Zaoqi's Blog -> Python数据分析教程 -> 图解Pandas ->
直方图
直方图
在线刷题
检查 or 强化 Pandas 数据分析操作?👉在线体验「Pandas进阶修炼300题」
Note
本页面代码可以在线编辑、执行!
导入与预设
虽然在 pandas 中可以直接调用 matplotliab 进行可视化,但是依旧需要进行相关设置,例如字体、精度等。
import pandas as pd
import numpy as np
import matplotlib.pyplot as plt

plt.rcParams['font.sans-serif'] = ['Songti SC']
plt.rcParams['axes.unicode_minus']=False
默认
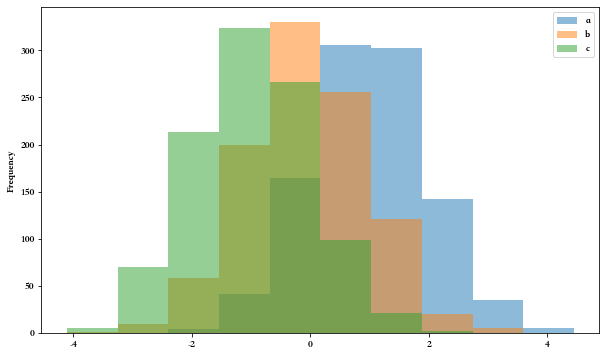
重新生成数据 df3 ,并制作直方图
df3 = pd.DataFrame(
    {
        "a": np.random.randn(1000) + 1,
        "b": np.random.randn(1000),
        "c": np.random.randn(1000) - 1,
    },
    columns=["a", "b", "c"],
)
df3.plot(kind = 'hist', figsize=(10, 6))
plt.show()

修改小区间
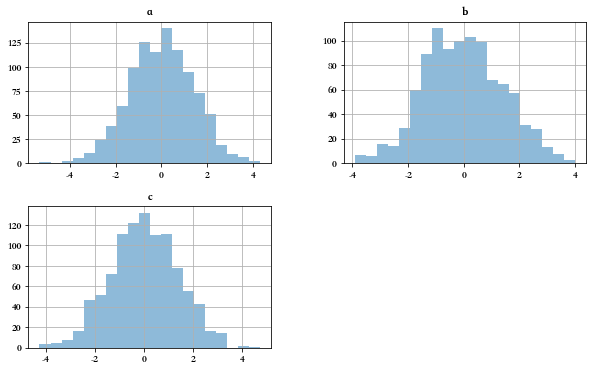
在上一题的基础上,堆叠直方图,并设置小区间为20个
df3.plot(kind = 'hist', figsize=(10, 6),alpha = 0.5,bins = 20,stacked=True)
plt.show()

On this page


