
Zaoqi's Blog -> Python数据分析教程 -> 图解Pandas ->
折线图
折线图
在线刷题
检查 or 强化 Pandas 数据分析操作?👉在线体验「Pandas进阶修炼300题」
Note
本页面代码可以在线编辑、执行!
导入与预设
虽然在 pandas 中可以直接调用 matplotliab 进行可视化,但是依旧需要进行相关设置,例如字体、精度等。
import pandas as pd
import numpy as np
import matplotlib.pyplot as plt

plt.rcParams['font.sans-serif'] = ['Songti SC']
plt.rcParams['axes.unicode_minus']=False
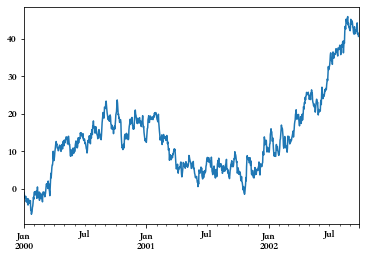
ts = pd.Series(np.random.randn(1000), index=pd.date_range("1/1/2000", periods=1000))
ts = ts.cumsum()
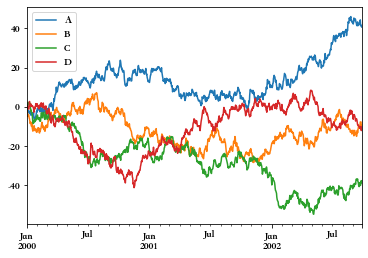
df = pd.DataFrame(np.random.randn(1000, 4), index=ts.index, columns=list("ABCD"))
df = df.cumsum()


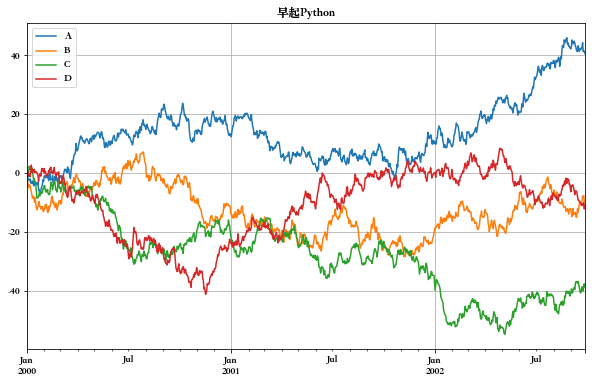
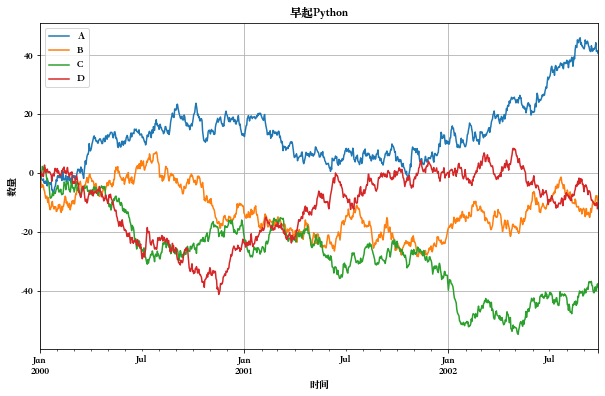
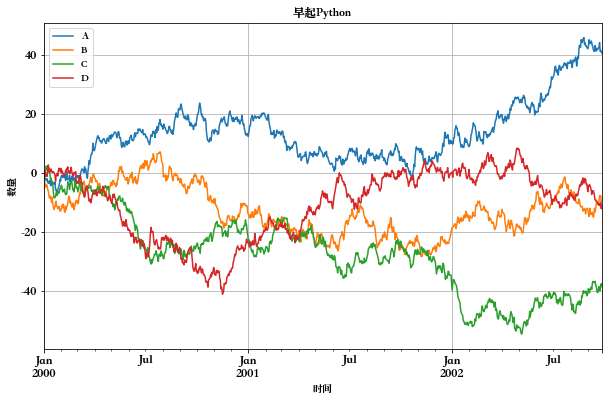
添加轴标签
在上一题的基础上,给X轴添加标签(时间),Y轴添加标签(数量)
df.plot(figsize=(10, 6), title='早起Python', grid=True, xlabel='时间', ylabel='数量')
plt.show()
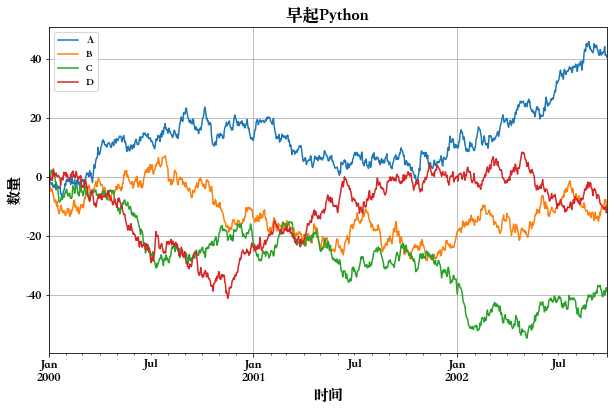
调整刻度大小
在上一题的基础上,将刻度调大一点
df.plot(figsize=(10, 6), title='早起Python', grid=True, xlabel='时间', ylabel='数量',fontsize = 13)
plt.show()
调整文字大小
在上一题的基础上,将标题、坐标轴文字适当调大
df.plot(figsize=(10, 6), grid=True, fontsize = 13)
plt.title("早起Python",size = 17)
plt.xlabel('时间',size = 15)
plt.ylabel('数量',size =15)
plt.show()
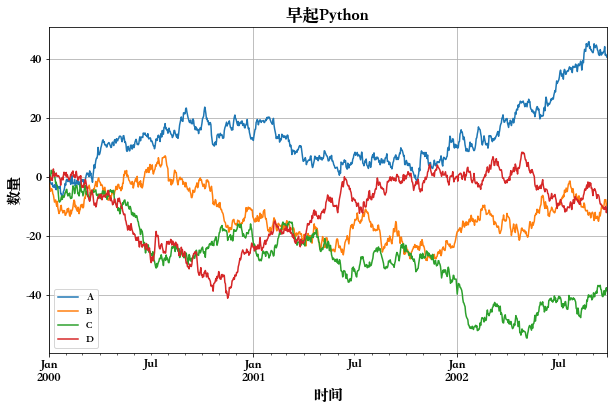
图例位置
在上一题的基础上,将图例位置调整到左下角
df.plot(figsize=(10, 6), grid=True, fontsize = 13)
plt.title("早起Python",size = 17)
plt.xlabel('时间',size = 15)
plt.ylabel('数量',size =15)
plt.legend(loc=3)
plt.show()
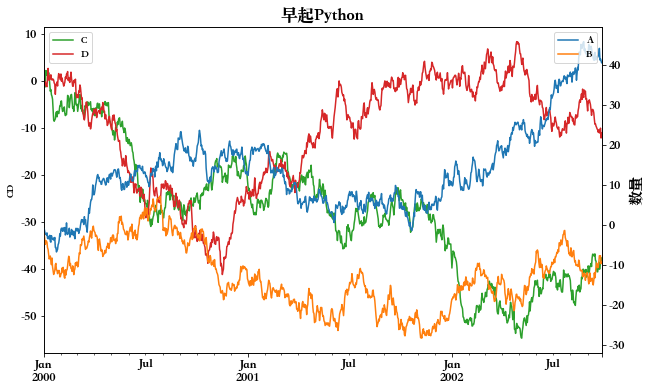
双y轴
A、B使用一个y轴,CD使用一个y轴
ax = df.plot(secondary_y=['A', 'B'], figsize=(10, 6), fontsize = 13)
ax.set_ylabel('CD')
ax.right_ax.set_ylabel('AB')
ax.legend(loc=2)
plt.title("早起Python",size = 17)
plt.xlabel('时间',size = 15)
plt.ylabel('数量',size =15)
plt.legend(loc=1)
plt.show()
On this page